1.0 | Motivation
Over the past decade, professional sports have increasingly embraced data-driven decision making. A well-known early example is Moneyball, where sabermetrics transformed how baseball teams evaluated player performance. Since then, the field has evolved significantly, with modern machine learning and computer vision techniques enabling far richer and more granular analyses. Basketball, in particular, presents an exciting challenge. It is a dynamic, continuous, and highly interactive sport, where player positioning, movement, and ball flow all matter simultaneously. When captured through broadcast footage, this complexity becomes a rich source of visual data that can be leveraged for tactical and performance insights.
At the highest professional levels, leagues such as the NBA rely on proprietary systems like SportVU, which use specialized multi-camera setups to track players and the ball in real time. While extremely powerful, these systems are expensive, closed-source, and inaccessible to many stakeholders. As a result, smaller clubs, local teams, amateur organizations, and independent analysts are effectively excluded from advanced spatial analytics.
HoopVision was built to help close this gap. The core motivation behind the project is to provide an open-source, cost-free basketball analytics system that can be used not only by researchers and enthusiasts, but also by smaller and local teams with limited budgets. By relying solely on standard broadcast footage and open-source tools, HoopVision lowers the barrier to entry for advanced analytics and enables broader access to modern computer vision techniques.
The system automatically detects and tracks players and the basketball, extracting actionable insights such as:
- Player positioning and movement
- Ball possession
- Passes and interceptions
- Team-level spatial control
All analytics are generated without proprietary hardware, using commodity GPUs and reproducible pipelines, and are made immediately available to the user.
Project repository:
HoopVision Repository
2.0 | System Overview
HoopVision is implemented as a containerized microservice application orchestrated via Docker Compose. The full stack consists of 11 services, integrating computer vision inference, data storage, orchestration, visualization, and monitoring.
2.1 | Core Services
Six services are custom-built and form the backbone of the system:
detector_service
Runs a fine-tuned YOLOv12 model to detect players and the basketball.team_assigner_service
Assigns players to teams based on dominant HSV color clustering inside player bounding boxes.court_service
Handles court panorama creation, keypoint matching, and homography estimation.orchestrator_service
Coordinates the entire processing pipeline via FastAPI calls.ui_service
Provides a Gradio-based user interface for uploading videos, selecting courts, and visualizing results.video_viewer_service
Streams processed output videos and minimap overlays.
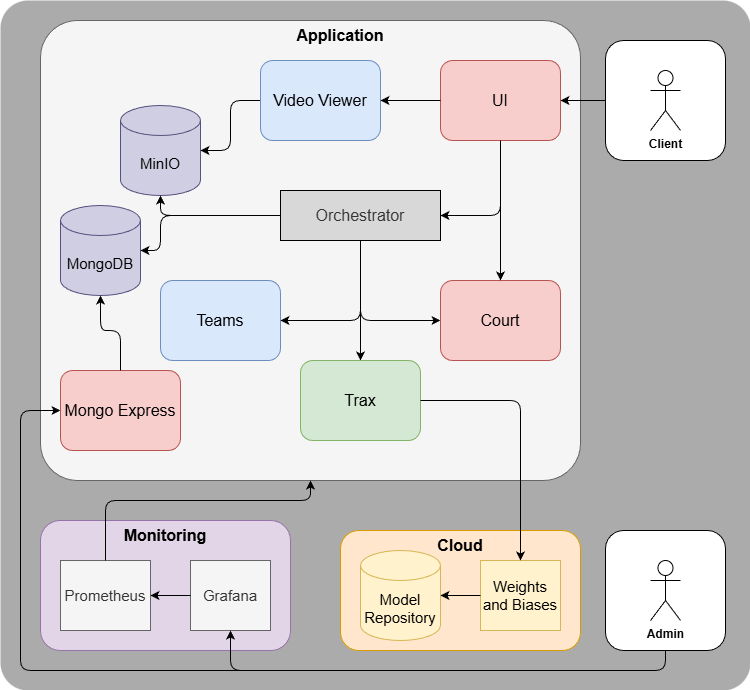
The remaining services provide infrastructure support:
- MinIO (S3-compatible storage)
- MongoDB (structured statistics storage)
- Mongo Express (database UI)
- Prometheus (metrics scraping)
- Grafana (monitoring dashboards)
The entire system can be built and launched using a single command:
./run.sh3.0 | User Workflows
From a user perspective, HoopVision is built around two straightforward workflows: defining the spatial context of a court and running analytics on a game. The goal is to keep interaction simple while hiding as much complexity as possible behind the scenes.
Court Creation
Before any analysis can take place, the system needs a reference court. This step is typically performed once per court and reused across multiple videos.
The user uploads a short video clip that sweeps across the basketball court. From this clip, HoopVision stitches together a single panoramic image of the court. The user then manually annotates the four court corners, gives the court a name, and saves it.
This reference image becomes the spatial anchor for all future analyses on that court. It is used to compute homography matrices that allow player positions from the broadcast view to be reprojected accurately into a standardized top-down court representation.
Basketball Analysis
Once a reference court exists, running an analysis is intentionally simple. The user uploads a basketball broadcast video (.mp4), selects the appropriate court from a dropdown menu, and clicks Run Analysis.
From there, the entire pipeline executes automatically. Players and the ball are detected and tracked across frames, players are assigned to teams, and ball possession events such as passes and interceptions are inferred. Player positions are continuously projected onto a top-down minimap, while annotated broadcast videos and structured statistics are generated in parallel. All results are stored and visualized without requiring further user input.
4.0 | Inside the Pipeline
Behind the scenes, the orchestrator_service coordinates the full inference pipeline. At startup, it fetches the current production YOLOv12 model from a Weights & Biases model registry, ensuring the system always runs with the latest validated model.
During inference, player and ball detections are generated and tracked using ByteTrack, producing consistent identities over time. Player tracks are forwarded to the team assigner, where dominant HSV color histograms are clustered using K-Means to separate teams.
Ball possession is inferred using lightweight, rule-based logic that combines spatial overlap and distance heuristics. While simple, this approach is fast and works well in most broadcast scenarios.
For spatial analysis, the court service computes homography matrices using SuperPoint for keypoint detection and LightGlue for robust feature matching. These homographies allow player coordinates to be reprojected into a top-down court view. Finally, the orchestrator overlays all information onto the original video, generates a synchronized minimap, uploads videos to MinIO, and writes structured statistics to MongoDB.
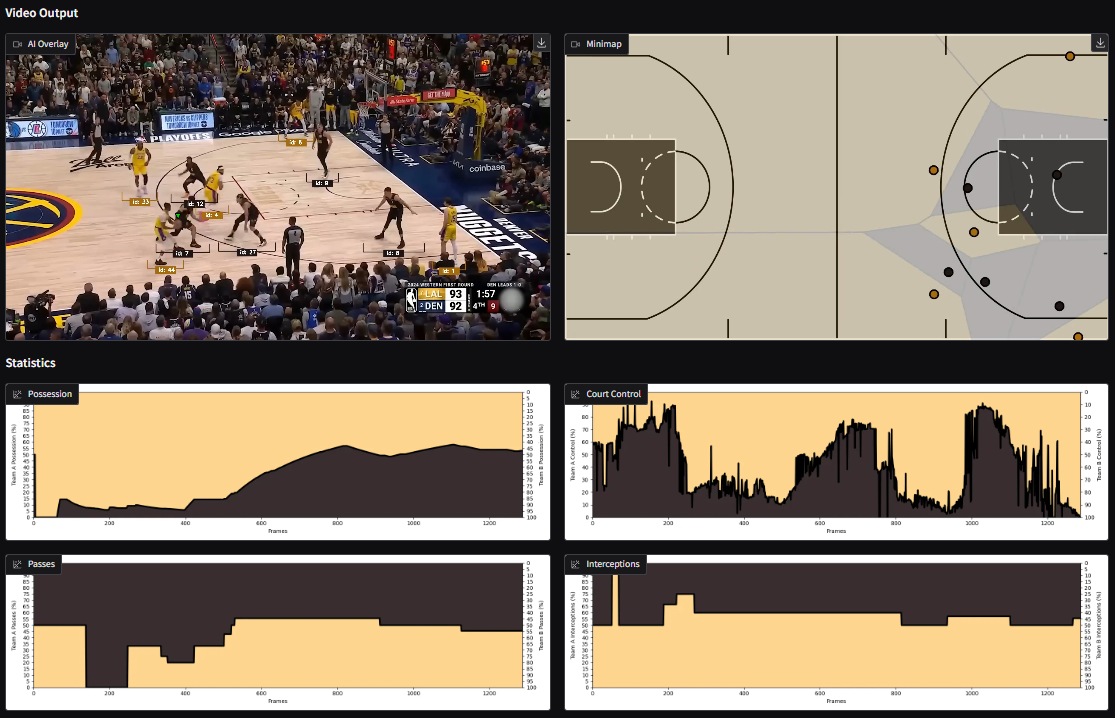
5.0 | What HoopVision Can Do
HoopVision already supports a range of analytical and visualization capabilities.
Players are tracked frame by frame and projected into a top-down view, enabling team-level spatial analysis such as court control. On the event side, the system estimates ball possession, passes, and interceptions at the team level.
All insights are presented through annotated broadcast footage, a minimap showing player movement, and interactive plots rendered directly in the UI.
6.0 | Models, Data, and Tooling
YOLOv12 was chosen for object detection due to its strong accuracy, fast inference times, and mature open-source ecosystem. Other architectures such as DETR and SAM were evaluated but ultimately discarded due to either lower detection performance or significantly higher latency.
Tracking is handled by ByteTrack via the Supervision library. Court homography relies on SuperPoint and LightGlue, with OpenCV used for geometric estimation and reprojection.
Two main datasets were used during development. A basketball players dataset from Roboflow was used to fine-tune player detection and suppress spectators. To address weak ball detection performance, a larger ball-focused dataset of roughly 14,000 images was used, increasing ball mAP@50 from around 80% to 92%.
All experiments are tracked in Weights & Biases, with both datasets and models versioned as artifacts. The production model is tagged accordingly and pulled automatically when services start.
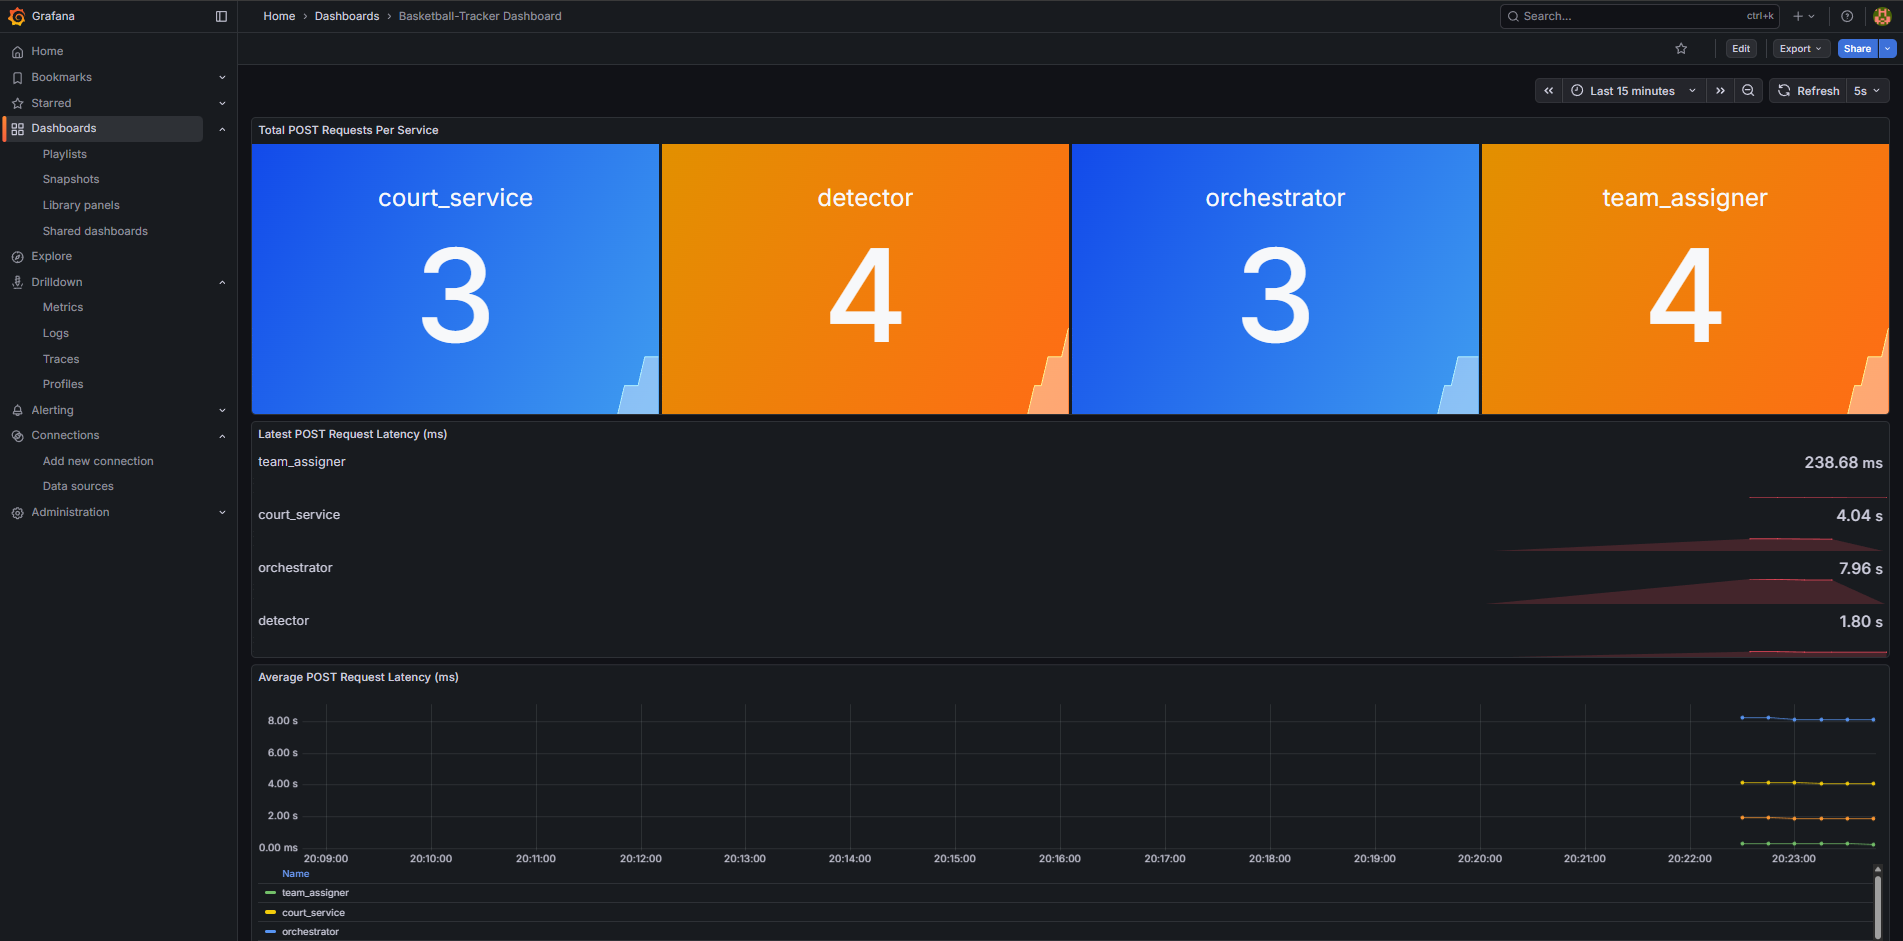
7.0 | Monitoring, Testing, and Reliability
System health is monitored using Prometheus and Grafana. Metrics such as API call counts, latest request latency, and average latency are scraped every five seconds and visualized in preconfigured dashboards.
The project also includes automated tests covering service connectivity, end-to-end video processing, court panorama creation, database connectivity, and cleanup of generated artifacts. These tests help ensure reproducibility and robustness of the pipeline.
8.0 | Reflections and Future Work
Several challenges emerged throughout development. Identity switching remains a limitation of generic tracking approaches, ball detection struggles under occlusion and fast motion, and proximity-based heuristics can occasionally trigger false interceptions. Court homography estimation is also sensitive to heavy player occlusion.
Despite these challenges, HoopVision delivers a fully functional, end-to-end basketball analytics system and provides a strong foundation for future work. Planned extensions include individual player statistics, ball heatmaps, automated highlight generation, live analysis, improved custom tracking that leverages team and court priors, and automated court keypoint annotation.
9.0 | Takeaways
HoopVision demonstrates that advanced basketball analytics can be built using open-source tools and standard broadcast footage. Beyond the technical results, the project offered hands-on experience with state-of-the-art computer vision, end-to-end MLOps, and system-level design decisions that directly impact scalability, reliability, and usability.
Most importantly, it shows that powerful spatial analytics do not need to be locked behind proprietary systems, making modern basketball analysis accessible to researchers, enthusiasts, and smaller teams alike.