1.0 | Introduction & Motivation
Pest and crop-related diseases are a major cause of yield reduction globally and in Sweden, leading to significant economic losses and environmental pollution from inefficient pesticide use. Recent advancements in machine learning (ML) and deep learning (DL) offer new opportunities to address these challenges. This study applied various ML methods to predict disease severity in crops for the upcoming week using a comprehensive dataset from 2016 to 2023, including crop data, pest population metrics, and meteorological data from Sweden.
For those interested in a more detailed breakdown of the methodology and results, you can download the full report here.
3.0 | Methodology
Data was gathered from Jordbruksverkets Prognos och Varnings API and SMHI’s Metrology API for the period 2016-2023. The study focused on seven unique pests and the three crops Höstvete, Rågvete, and Vårkorn. There were including specific associated pests. Weather data from the closest 3 weather stations was aggregated to approximate daily field weather, and then further aggregated to weekly frequency. Yearly cumulative weather features were also calculated.
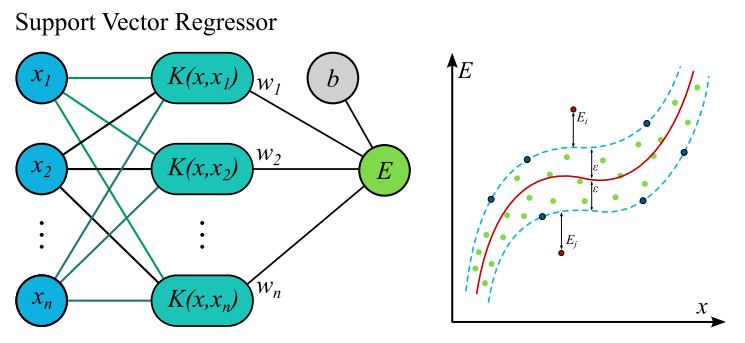
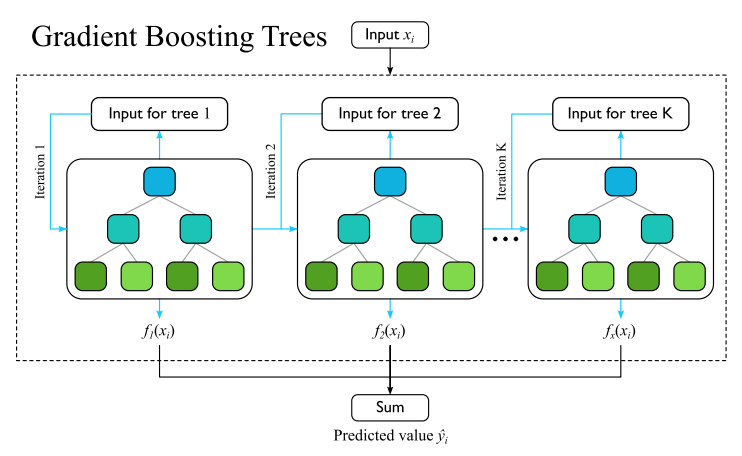
The following models were tested and evaluated: HistGradientBoosting Regressor, XGBRegressor, FeedForward Neural Networks, Support Vector Regressor, Transformer, LongShortTermMemory, and DecisionTreeRegressor. Their performance was evaluated using MAE, MSE, and \(R^{2}\) metrics.
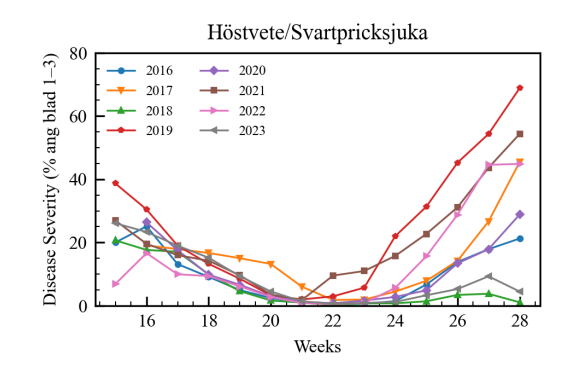
Exploratory data analysis revealed that average disease severity varies significantly by year. Years with relatively low amounts of pests correlated with low harvest yields, attributed to adverse weather conditions like droughts.
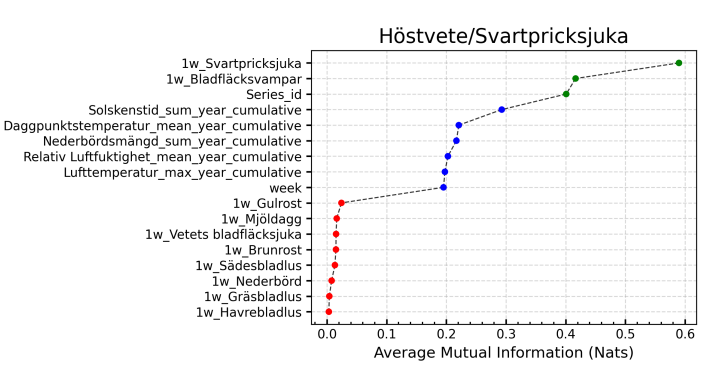
A key observation was the high correlation between the lagged value of the target and the target itself across all crop and pest combinations. Cumulative weather parameters, when introduced, showed an increase in model performance. Some pests were also found to be highly correlated with each other, which significantly boosted model performance. Average Mutual Information (AMI) was used to quantify the information shared between features and the target variable.
The model selection was based on their effectiveness for structured tabular data and time-dependent processes. Gradient boosted models like HistGB and XGBoost are effective for tabular data, while Decision Tree Regressor serves as a good baseline model. FeedForward Neural Networks can learn complex non-linear relationships, and LSTMs are good at handling time-dependent processes. Transformer and Support Vector Regressor were also included, with Transformers showing improved performance over recurrent models in certain time-series applications.
Model evaluation was performed using 10-fold Cross Validation to ensure robustness. Folds were created by selecting a percentage of Series_id’s without replacement as the test set to maintain the integrity of the series. Hyper parameter tuning with cross validation was performed for all models before the final evaluation.
4.0 | Results and Analysis
The model performance was detailed through heatmaps and tables showing \(R^{2}\), MAE, and MSE scores across different crop/pest combinations and models.
All models demonstrated satisfactory performance for all höstvete and pest combinations, with most capturing at least \(\ge70\%\) of the variation in the target (\(R^{2}\)). The best performing model was HGBR, which achieved an \(R^{2}\) score for höstvete approximately varying between 0.80 and 0.90. SVR showed better \(R^{2}\) scores on the smallest dataset, performed comparably on the medium-sized dataset, and was outperformed by HGBR on the largest dataset, consistent with previous research. SVR’s ability to capture global patterns with smaller datasets is attributed to its use of support vectors. With larger datasets, the reliability of most classifiers, including tree-based models like HGBR, increases due to better refined splits.
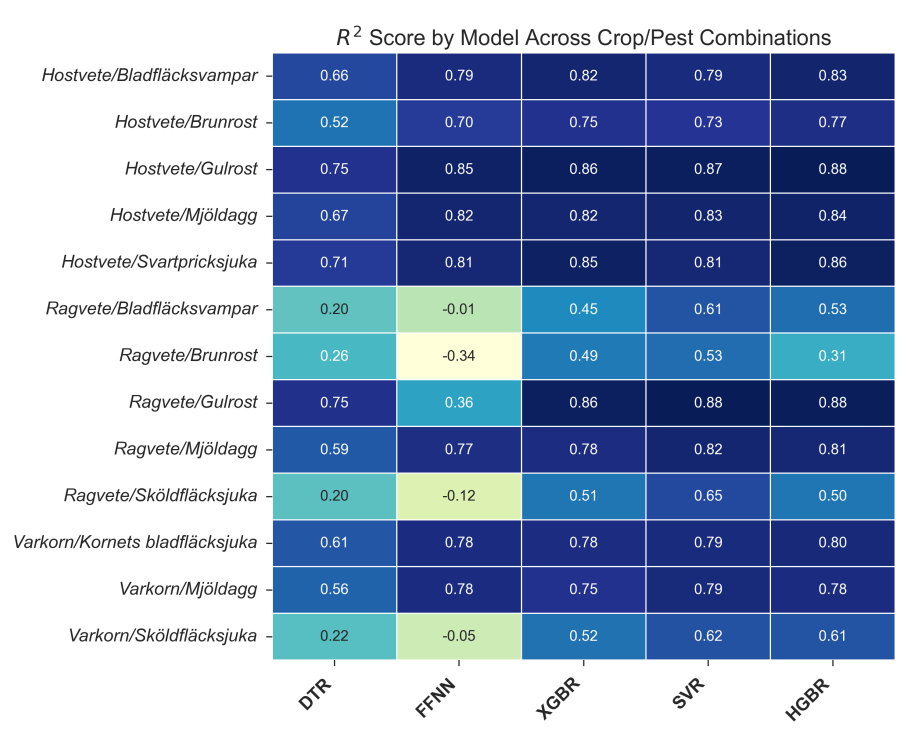
Models performed worst on the rågvete dataset, with the FFNN model conspicuously underperforming, sometimes obtaining negative \(R^{2}\) scores. This is likely due to the small size and complexity of the rågvete dataset, which did not provide sufficient data points for the models, particularly neural networks, to capture the variation in the target. The lack of mutual information between features and the target in some combinations, like rågvete/brunrost, also contributed to poor performance. Similarly, low performance on combinations involving sköldfläcksjuka as a target was observed, which figures 5 and 6 also attribute to insufficient meaningful correlations.
The MAE heatmap showed substantial variance in performance, with some targets like gulrost in the höstvete dataset being predicted with a low MAE of 0.55, while others like mjöldagg in the rågvete dataset had high MAE values. The MSE metric provided a good indication of performance in less common cases where target values are higher, which correlates to the important aspect of predicting peaks.
Analyzing the average performance across all crop and pest combinations, Support Vector Regressor (SVR) showed a slight edge in capturing the average target variance (\(R^2\)). However, HistGradientBoosting Regressor (HGBR) performed better on average Mean Absolute Error (MAE) and Mean Squared Error (MSE), indicating superior accuracy, particularly when dealing with outlier values. Further examination of the distribution of prediction errors highlighted HGBR’s strength, as its errors were more heavily concentrated around zero, meaning its predictions were generally closer to the actual values.
The potential practical application of the HGBR model is significant. It could be used to provide early warnings for sharp increases in pest reproduction, enabling proactive pesticide application. This has the potential to reduce the overall amount of pesticide needed and, consequently, lead to increased harvest yields by mitigating pest damage more effectively.
5.0 | Future Work
Several current issues could be addressed to further improve results. The distance to weather stations for many weather parameters is generally high, often over 20 km, which means weather station data may not accurately represent field weather conditions, causing poor feature performance. While a naive method of taking the mean from the three closest stations was used, more advanced methods like spatial and spatiotemporal kriging could be explored. Using archived weather forecast data from sources like SMHI’s MESAN, which provides gridded forecasts, is another approach that would also allow using more weather parameters and training on forecast data necessary for model deployment.
Another important feature for pest prediction, leaf wetness duration, is not included by SMHI but could be estimated from available weather data. The sensitivities of different diseases for different crop strains also showed promise but were removed due to missing values for certain combinations.
Outlier detection is challenging due to the high variance and positive skew in measurement values, and regular methods would remove data crucial for predicting peak pest growth. Future attempts could rigorously identify fields with radically different target distributions for the same pests and treat them separately or drop them, possibly using the KL-divergence metric.